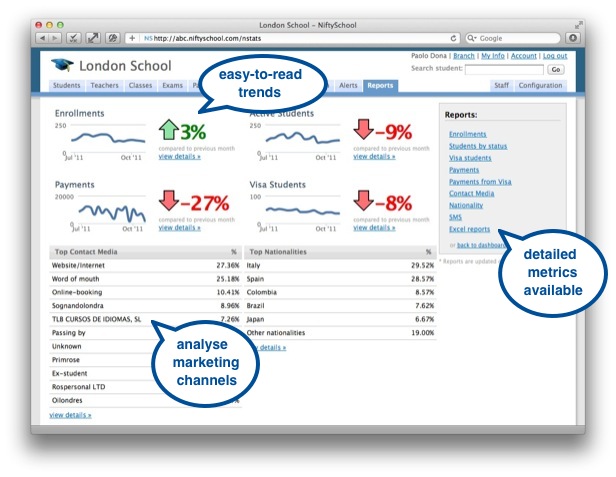
The reporting dashboard gives you a quick understanding of how things are going. Enrolments, payments, contact medias, and so on. Then drill down and analyse specific metrics.
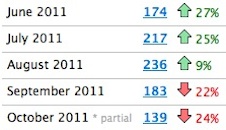
NiftySchool keeps history of how your school did over time so it is easy to compare months from different years or see long term trends. You can always go back in time and download lists of past students to promote new courses.
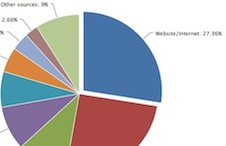
How do customers know about your school? Keep track of your marketing channels over time and gauge if your marketing efforts are paying off. Also, record students sent by agencies so that you can pay them correctly.
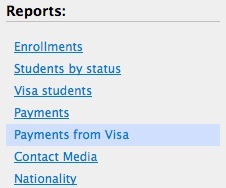
Reports cover a wide range of metrics, from number of enquiries to cache flow and visa students. You can also download full lists of students in Excel format or prepare birthday cards in advance with the birthday report.